Grow your Shopify store faster with actionable analytics.
Everhort’s cohort analysis tools are the easiest and fastest way to understand repeat purchase behavior and improve the lifetime value of your customers.
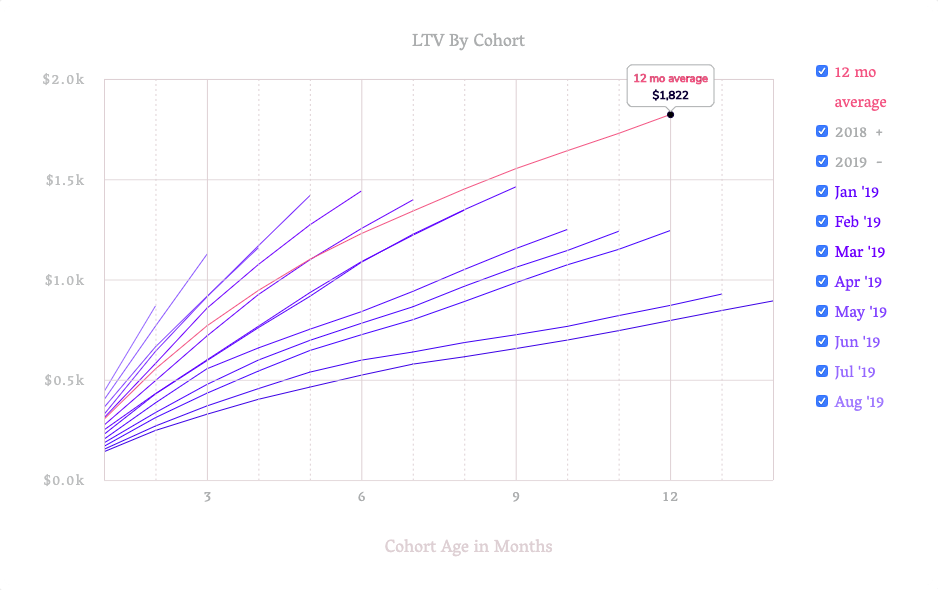
Visualize Lifetime Value
Repeat customers are the lifeblood of your business, but other tools make it hard to see what's happening over time. Everhort's unique LTV chart groups customers by the month of their first purchase, which lets you get rapid insight into how repeat purchase behavior is changing over time.
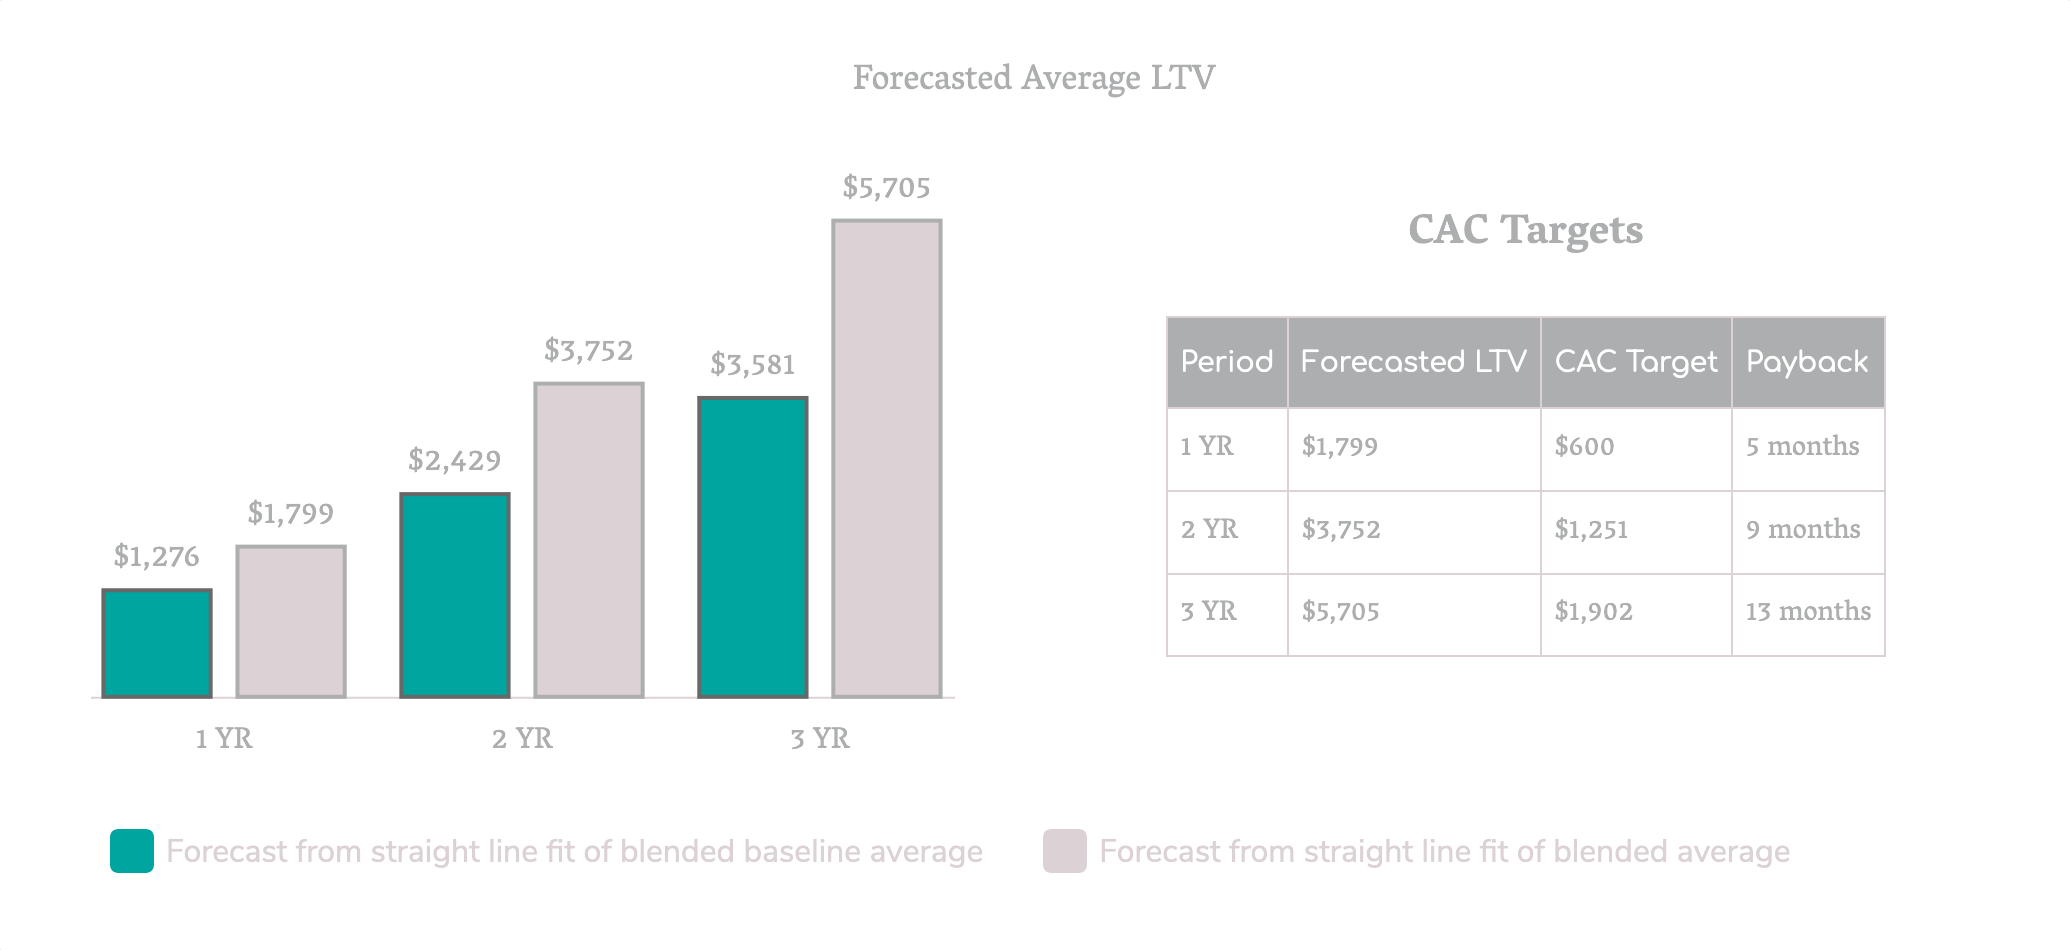
Estimate CAC
Forecast LTV based on historical performance and estimate how much you can spend to acquire customers given a projected payback period.
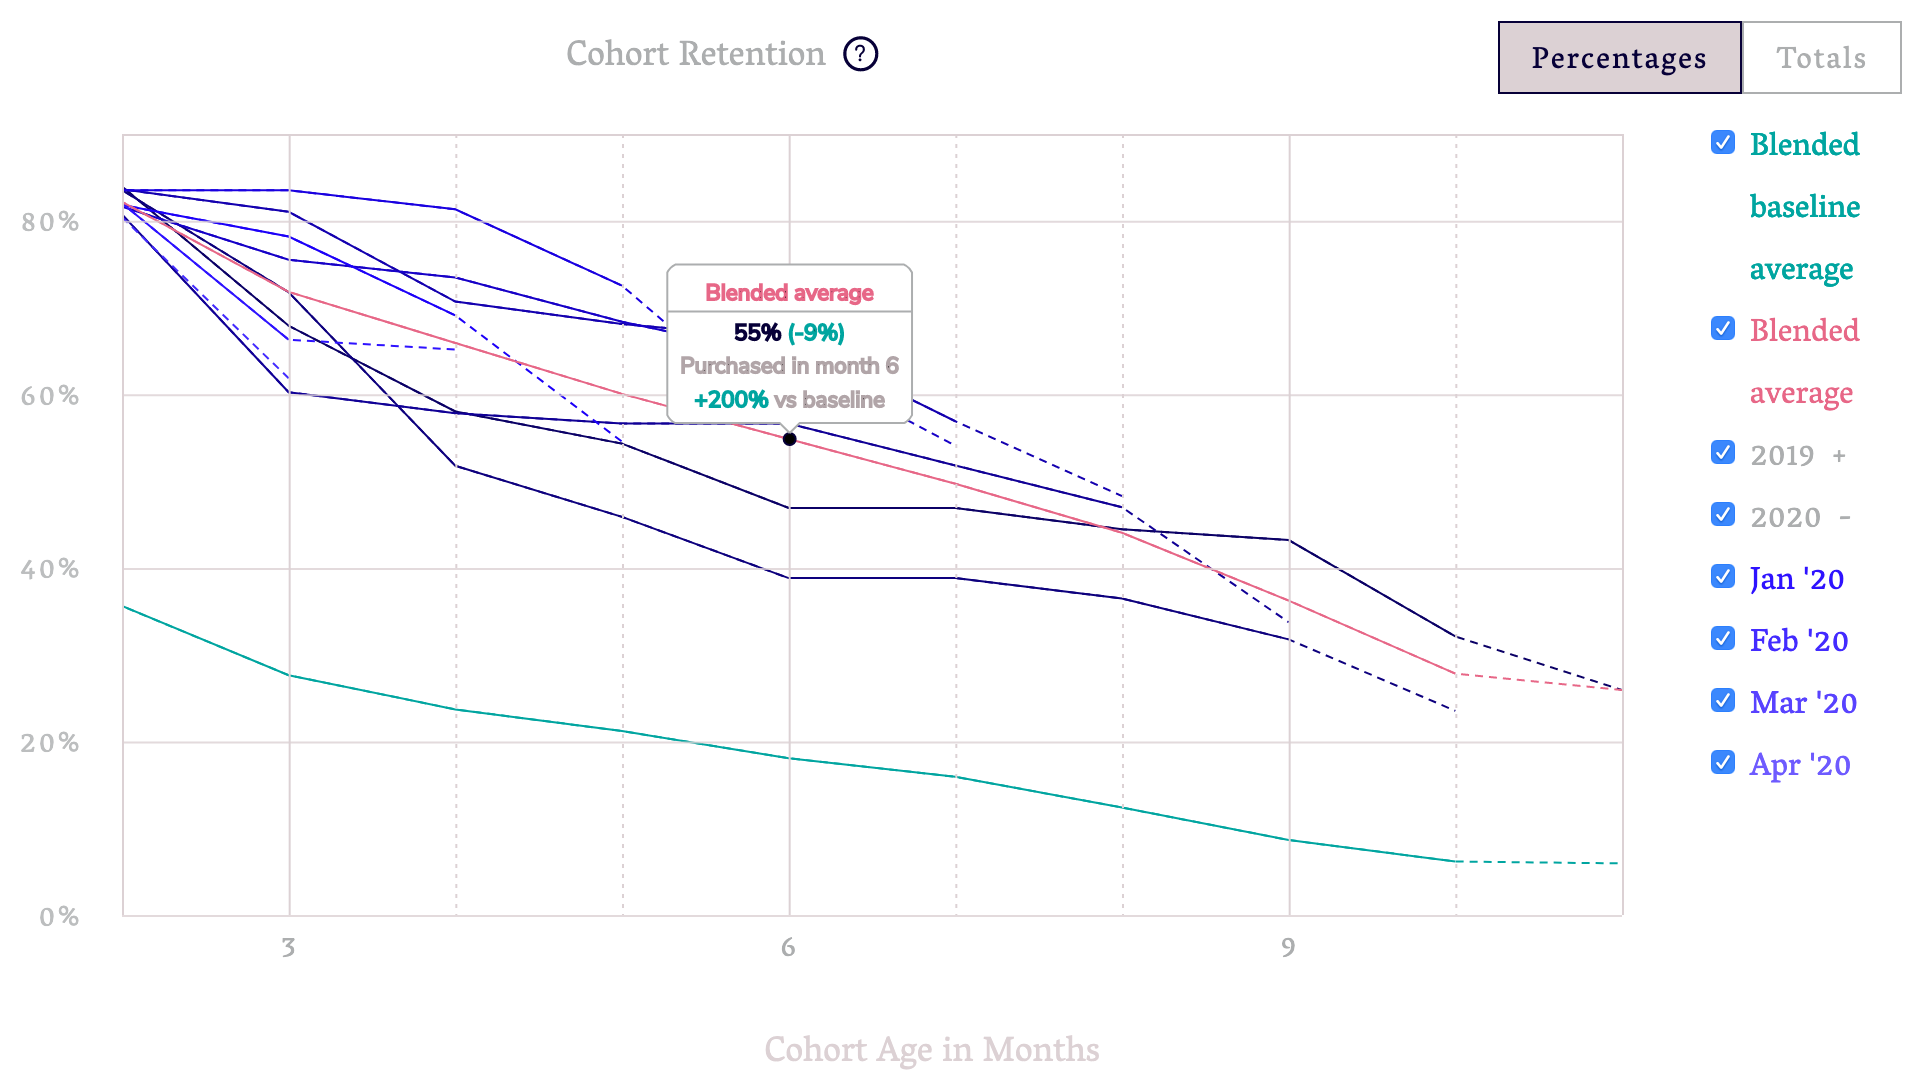
Visualize Retention
See how sticky your product is across cohorts and how often customers return to purchase.
Get started.
Start a free trial and start gaining insight into the metrics that matter.